| news Topic | Report of Workshop |
| Date & Day | 16th February, 2024 |
|
Event Name: Workshop |
Date/Day: 16.02.2024 /Friday |
|
Organize By: Department of Computer Science |
Designation/Organization: Assistant Professor / IMS UC |
|
Topic: Data Visualization through Tableau |
Scheduled Timing: 1:30 PM onwards |
|
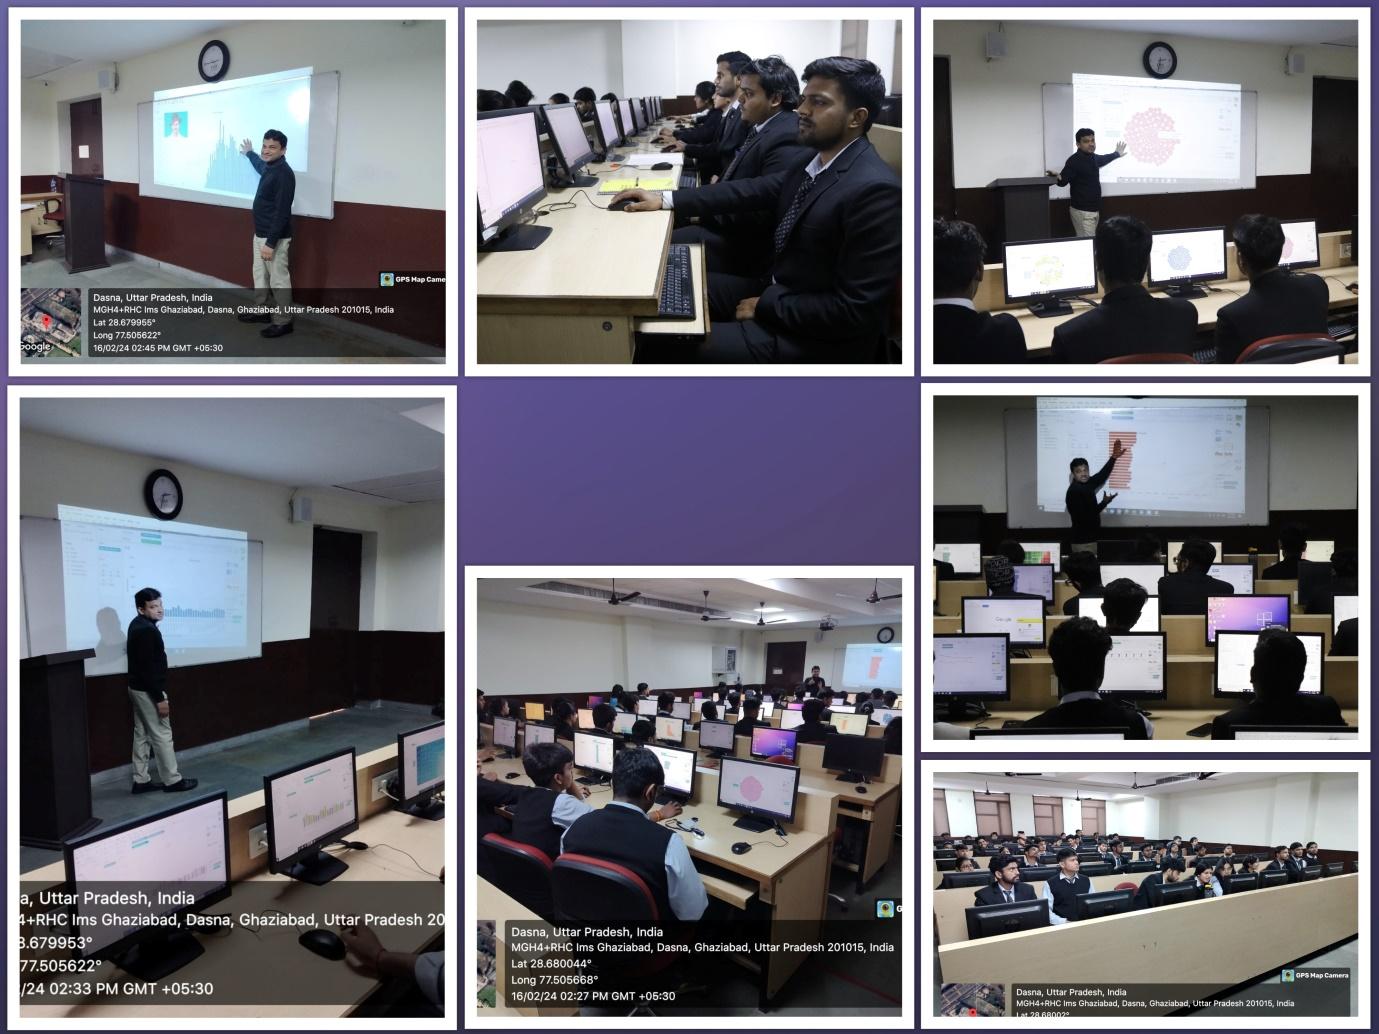
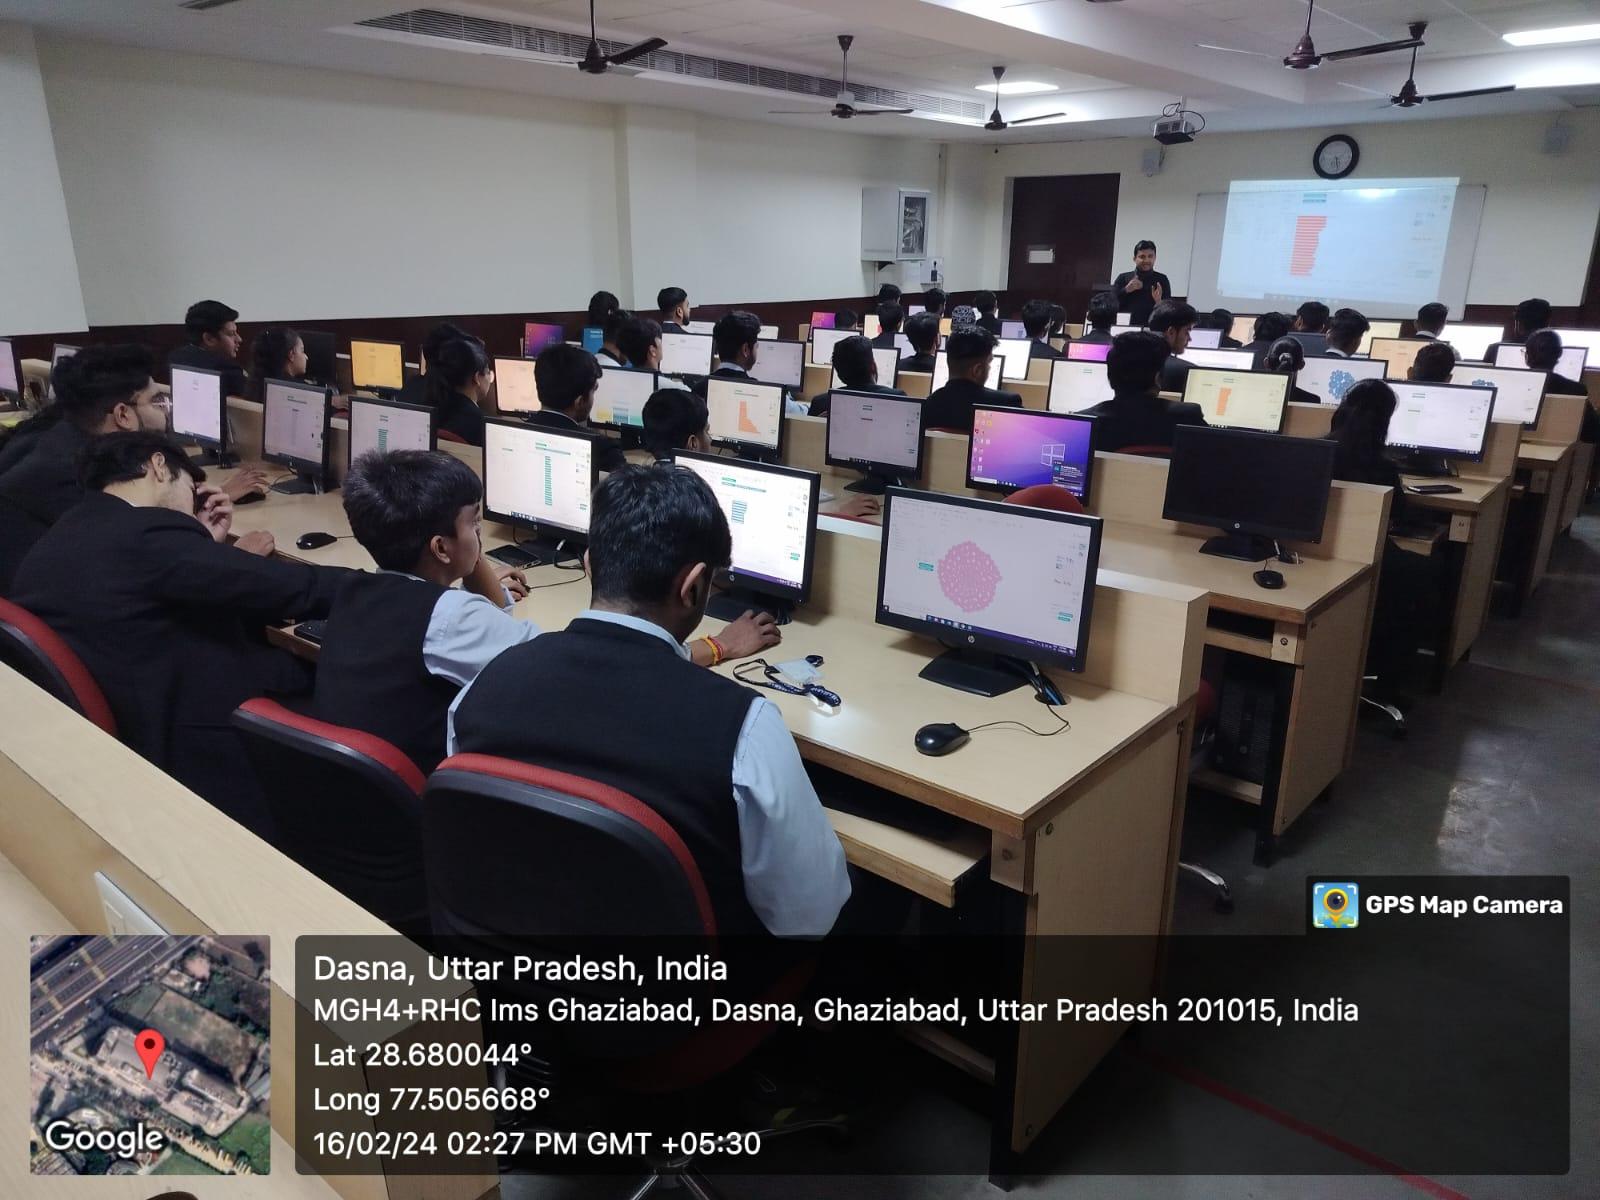
Number of Participants: 45 |
Venue: IMSUC, Computer LAB 4 |
|
Budget Approved: Nil |
Total Expenditure: Nil |
Summary of the event-
On February 16, 2024, Department of Computer Science at IMS University Courses Campus organized a dynamic workshop focused on the Data Visualization through Tableau. Guided by experienced facilitator - Mr. Surya Saxena, Assistant Professor, Department of Computer Science. He learned to create an array of visualizations, from basic bar charts to intricate heat maps, leveraging Tableau's diverse visualization options. One of the workshop's highlights was the exploration of interactive dashboards. Participants discovered how to combine multiple visualizations into cohesive dashboards, enhancing user engagement and facilitating deeper exploration of data trends. By incorporating filters and parameters, they learned to tailor dashboards to meet the specific needs of end-users.
“You gain valuable knowledge and skills by “doing” instead of just watching.” In today's data-driven world, the ability to effectively visualize and communicate insights from data is paramount. Recognizing this importance, organizations are increasingly turning to tools like Tableau to unlock the potential of their data. Recently, a data visualization workshop conducted through Tableau shed light on the transformative capabilities of visual analytics.
As the workshop concluded, participants emerged equipped with the skills and confidence to harness the power of data visualization in their respective domains. Armed with Tableau's capabilities, they were empowered to transform data into actionable insights, driving innovation and impact within their creativity.
Learning Outcome: After completion of the workshop students were able to:
Unlock the transformative potential of data visualization.
Equipped with the tools and techniques to leverage Tableau effectively.
Visualize & Present data through Tableau.
Using various types of charts, maps in Tableau.
Equipped to create compelling visualizations, design interactive dashboards, and communicate insights effectively.
Students attending workshop in lab 4